
Probability is one of the core components of data science, along with mathematics, computer science, and programming languages. So, succeeding in a data science career is built upon a solid foundation in these concepts. In this article, we will be focusing on probability concepts that are used in data science.
A recent Gallup survey shows 12 % of U.S. workers use AI daily and nearly 25 % use AI several times a week, especially in the tech and finance sectors. Be it understanding uncertainty in real-world data, building predictive models, or evaluating outcomes, different probability concepts are used in almost every stage of a data science project lifecycle.
Whether you are working with machine learning, statistical inference, or data-driven business decisions, you need to have a strong understanding of probability so that you can reason logically under uncertainty.
Common Probability Concepts Used in Data Science
The following are some of the common and most widely used probability concepts in data science that you need to learn to grow in your data science career.
A random variable is the numerical representation of the outcome of a random process. It is used to model uncertain quantities such as customer behavior, sensor readings, or stock prices. Two main types of random variables are:
They are the basis for probability distributions and modeling real-world data mathematically.
Probability distributions describe how the values of a random variable are distributed. Probability distribution is the core of data analysis, statistical modeling, and machine learning.
The following are commonly used distributions in data science:
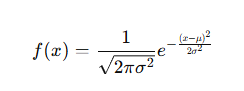
Example: Distribution of exam scores
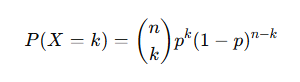
Example: Number of users clicking an ad out of 100 visitors.
P (X=x) = px (1−p) 1−x
Example: Whether an email is spam (1) or not (0).
By properly understanding distributions, you can choose appropriate models and make assumptions about data behavior.
It is used to measure the probability of an event occurring when another event has already occurred. It is expressed by:
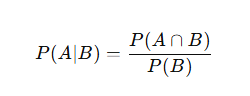
Example: What is the probability a user buys a product (A) given they clicked an ad (B)?
In data science projects, this is used for:
Algorithms like probabilistic models rely on conditional probability.
Bayes’ Theorem
Bayes’ theorem is among the most widely used probability concepts in data science. It is used to describe how to update the probability of a hypothesis depending on new evidence.
The formula looks like this:
Example (Spam Detection):
This theorem can be applied in various applications, such as:
Spam filtering
Medical diagnosis models
Fraud detection
Bayesian machine learning models
Bayes’ theorem helps data science professionals to refine predictions as new data becomes available.
Expectation or expected value represents the average outcome of a random variable over several trials. Whereas, variance means how much the data deviates from the mean.
Example: If a user spends $10, $20, or $30 with probabilities 0.2, 0.5, and 0.3, respectively, the expected spend helps businesses forecast revenue.
Example: If two machine learning models have the same accuracy, the one with lower variance is considered to be more reliable.
This probability method is used to understand how data is spread and how reliable a model is.
This states that the distribution of sample means follows a normal distribution irrespective of the original data distribution, provided the sample size is large.
This probability concept is used in application areas like:
It helps data scientists apply the normal distribution assumption to non-normal data as well.
This law states that if the number of observations increases, the sample mean nears the true population mean.
This concept is widely used for:
It is the basis for popular practices like A/B testing and analysis based on simulations.
Final thoughts!
Probability is the main pillar of data science. Be it modeling uncertainty with random variables or making informed predictions with Bayes’ theorem, the concepts of probability are used across various applications in the data science lifecycle.
By learning these probability concepts and their applications with the best data science certifications, you can improve the analytical accuracy of the model as well as strengthen data-driven decision-making.
Frequently Asked Questions
In data science technology, probability is used to manage uncertainty, make predictions, and evaluate outcomes, especially when working with incomplete or noisy data.
Yes, Bayes’ Theorem is widely used in probabilistic models, classification algorithms, and decision-making systems that update predictions based on new data.
Data scientists are expected to have a strong understanding of core probability concepts. If they are looking to advance in their data science careers, then they must look for advanced topics for specialized roles like machine learning research or statistical modeling.
This website uses cookies to enhance website functionalities and improve your online experience. By clicking Accept or continue browsing this website, you agree to our use of cookies as outlined in our privacy policy.