
In the times of big data, size is only step one. The value is in what you can derive from the data! Welcome to the age when grouping and summing rows no longer work. Data engineers are being asked to produce real-time insights across multiple dimensions quickly, flexibly, and on scale.
And guess what? Spark SQL is rising to that challenge.
Over 79% of organizations that use Spark SQL report an increase in the speed of analytics, and one particularly positive finding is "40% improvement" for organizational data with complex, multi-level clustering across aggregations (Statista, 2025), these are not just optimizations; these are efficiencies that can transform reporting from reactive to predictive intelligence.
If you are a data engineer, analyst, or someone otherwise involved with data analytics, you should know, advanced aggregations in SPARK (programming language) SQL are a necessity!
Why Go Beyond Basic Grouping?
Traditional GROUP BY in SQL is good when you can slice data on just one axis. But what if you want to
It is going to be impossible with basic SQL without either writing multiple queries or expensive joins and unions. Certainly not ideal when you have billions of records in your DataFrame. Advanced aggregations in Spark SQL, like GROUPING SETS, ROLLUP, and CUBE, save the day.
Quick Comparison: Which Aggregation Strategy Fits What?
|
Aggregation Type |
Best For |
What It Does |
|
GROUPING SETS |
Custom summary combinations |
Returns result sets for each grouping specified manually |
|
ROLLUP |
Hierarchical reporting (e.g., Year → Quarter → Month) |
Aggregates from detailed to summary levels |
|
CUBE |
Full cross-tab analytics |
Returns all combinations of grouping dimensions + subtotals |
Let’s Dive into Each: Use-Cases + Syntax
1. GROUPING SETS: Tailor-Made Aggregations
You could be interested in only specific combinations of aggregations and not others. GROUPING SETS is your SQL scalpel.
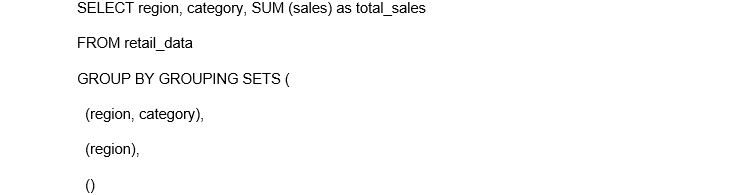
This returns:
Use it when: You want to have complete control of your rollups without excess calculations.
2. ROLLUP: For Hierarchical Summaries
You can think of ROLLUP as a built-in hierarchical explorer.

It produces:
It will march through the grouping ladder for you. In DataFrame API, it is. rollup ("brand", "product").
Use it when: You want progressive totals in dashboards, such as sales by city → sales by state → sales total by country.
3. CUBE: Maximum Combination Power
CUBE does any combination of columns, such as:

It is the heavy lifter of aggregations, at its best when you need to pivot data along multiple axes.
Use it when: You’re creating a BI-style summary table (or multidimensional report).
Spark-Specific Tips: Boosting Performance in Big Data Context
No matter if you're manipulating data using SQL statements or DataFrame functions in SPARK, a few best practices can improve your output:
Be clear on which grouping status you are working with (e.g., is the row a summary total or a summary part?).

Empty in the results, NULL is often an indicator that a field wasn’t included in that level of aggregation. Clean up dashboards using COALESCE () or CASE.
If you are aggregating on a big DataFrame in different ways, cache your base after applying your cleaning.
Because CUBE returns all possible combinations, use it with caution on high cardinality columns so as not to generate an excessive number of result rows.
When it comes to query plans, check. Explain () to make sure Spark is taking advantage of the optimized aggregation pathways.
Real-World Example: Sales Dashboard in Spark SQL
Think about trying to create a monthly sales dashboard for a retail chain with 50 cities and 20 product lines. Here’s a typical workflow:
Now imagine doing that across five hundred million records and getting results in seconds. That’s what big data gets with Spark.
Aggregate Like a Pro
In Spark SQL, advanced aggregations are not just a nice-to-have; they are vital for today’s modern data processing. Whether you have real-time dashboards to fulfill requirements or are working on multi-dimensional or multi-level reports, GROUPING SETS, ROLLUP, and CUBE will help you aggregate and summarize data smarter and faster.
To stand out as a data engineer, augment your technical skills with an industry-recognized program, like USDSI’s Data Science Certifications, which provide effective opportunities to grow your skills and expertise in big data and analytics.
In big data, being successful is not about how much you store; it is about how well you summarize what you have stored.
This website uses cookies to enhance website functionalities and improve your online experience. By clicking Accept or continue browsing this website, you agree to our use of cookies as outlined in our privacy policy.