
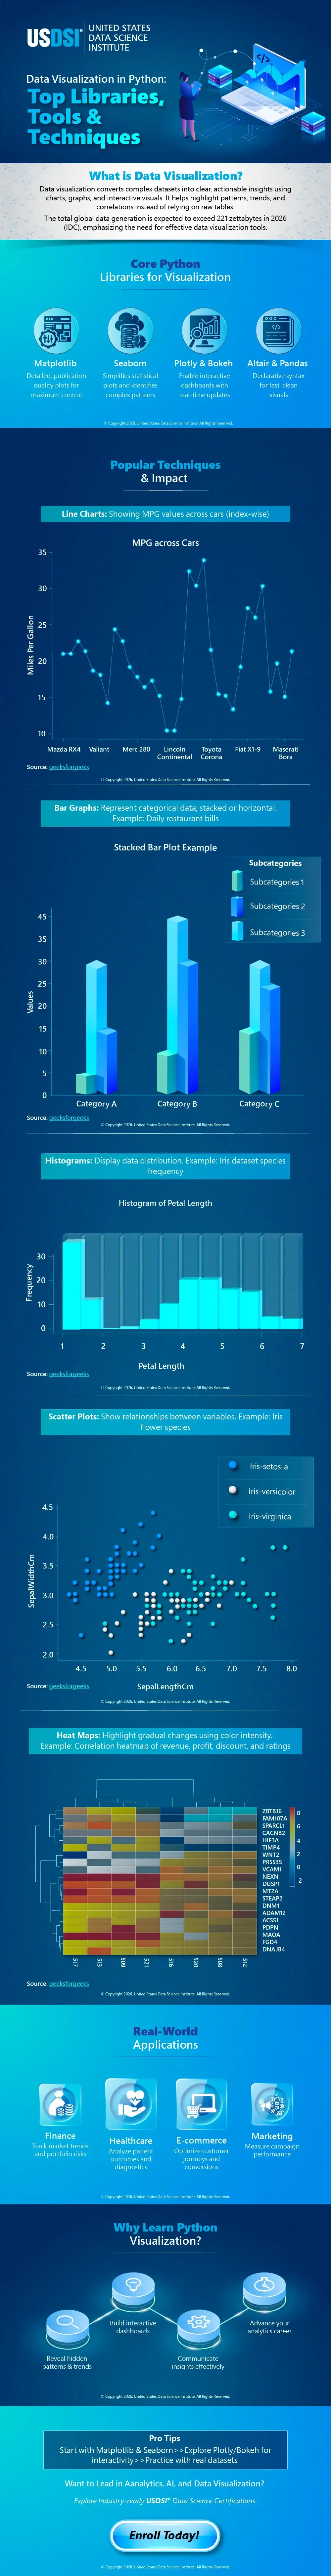
Data is the force not only in its collection but also in its visualization. The capability to transform the raw data into practical insights is paramount in the age when global data creation is expected to reach 221 zettabytes in 2026 (IDC). Python Data visualization converts numbers into stories and discovers trends, patterns, and correlations that cannot be discovered in the table.
Python provides a variety of libraries making this possible. Matplotlib offers detailed, publication-quality plots under fine-grained control, whereas Seaborn simplifies the visualization of statistics, and complex patterns can be readily understood. In interactive dashboards, Plotly and Bokeh have a real-time update option, which makes it possible to make data-driven decisions instantly. Libraries such as Altair and Pandas also make it much faster to produce clean and declarative visuals.
Python visualizations come in all forms, from line charts tracking trends over time to bar graphs, scatter plots, histograms, and heatmaps, followed by use in all industries: monitoring the trend in the market, examining the results of patients in healthcare, evaluating marketing campaigns, and figuring out the e-commerce strategy.
Learning such tools is no longer a choice. USDSI® data science certifications equip professionals with the skills to reveal hidden insights, develop interactive dashboards, and communicate data effectively. Turn raw data into interesting stories and accelerate your data science career.
Start mastering Data Visualization in Python today!
This website uses cookies to enhance website functionalities and improve your online experience. By clicking Accept or continue browsing this website, you agree to our use of cookies as outlined in our privacy policy.