Ever worked on a project that required you to work with datasets? Chances are, you had to categorize similar data into groups when doing data analysis. Doing such categorization is an extremely effective way of identifying data patterns that can be easily ignored otherwise. It is through such categorization or 'clustering' that we are able to identify hidden and difficult-to-find data patterns.
Clustering, in essence, is a method that groups data based on the similarities between distinct data. There are several commonly used clustering methods but one of the more effective methods by far is the K-Means Algorithm. It's an unsupervised machine learning algorithm that can be easily implemented in Python and is much easier to understand as compared to other clustering methods.
In this article, we will take a look at the clustering done by the K-Means Algorithm so that you can have a brief understanding of the same.
As we have already discussed above, Clustering is essentially a process wherein a machine learning algorithm without any human overview or supervision separates and groups together data from an unlabelled dataset on the basis of similarity of the data involved.
Datum or data that have properties that are related or similar in nature are categorized together in groups and these groups are called clusters. Each group or cluster has data that has differing characteristics from the data of another cluster. Each cluster is distinct from the other.
Some of the commonly used algorithms used for creating such clusters are:
K-Means algorithm is one of the most popular methods for creating clusters in data sets. The K refers to the fact that the letter ‘K’ is a variable that is defined by the data science professional. Whatever value is assigned to ‘K’ by the data science professional is the number of clusters that an unsupervised algorithm will group the data into from the dataset.
The algorithm functions by calculating the distance within each cluster and then the distances are squared and added together. The algorithm then minimizes the sum of the squared distances between the data clusters. It also actively attempts to lower the spatial gap between the group of data points and the centroid (the central point of the cluster).
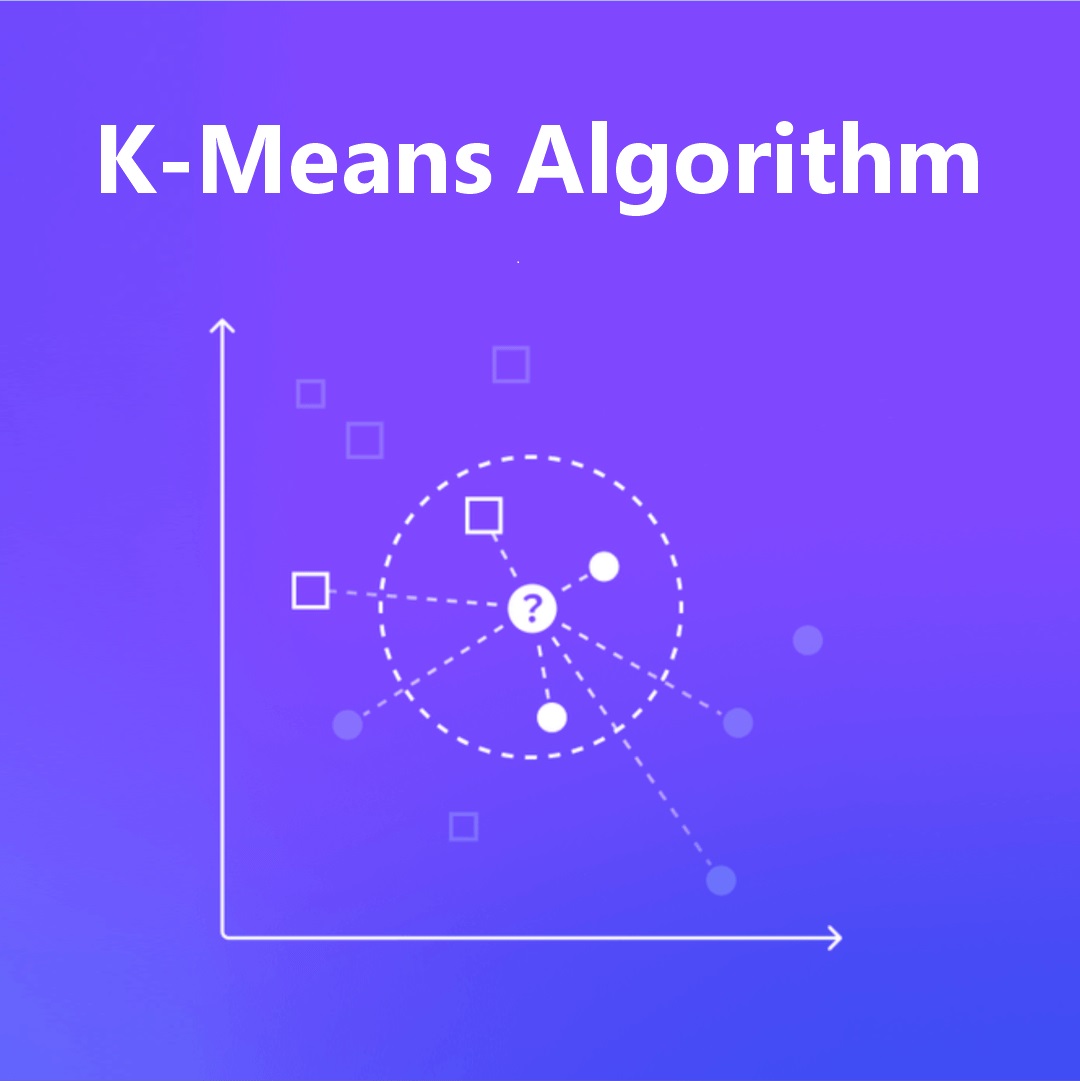
The algorithm starts by initiating centroids at K number of random points within the data set and the surrounding data points are allocated to centroids on the basis of the gap between the centroids and the data points. Afterward, the centroid is shifted to the central area of the newly formed cluster. Now, the surrounding data points are once again reassigned based on their proximity to the centroid. This process repeats itself until there are no more adjustments or shifts in centroids or data points and they remain consistent in their cluster. The process can also be set to be terminated once it has completed a certain number of cycles. Due to such a hard method, the K-Means algorithm leads to a situation wherein any particular data point can only belong to one cluster.
How is K-Means used?
Data science professionals use K-Means for numerous operations and knowing how to use this algorithm is one of the essential data science skills
The functioning of the K-Means algorithm is provided below:

Finding the value of 'K' need not be guesswork and there are a number of methods a data science professional can use to find the value of ‘K’ for the dataset in hand. Here are some manual ways that can be used to find out the value of ‘K’.
It's one of the most used methods for determining the most suitable number of centroids for a data set because of its simplicity and the ease with which it allows visualization. In the elbow plot methodology, the algorithm is run multiple times with different values for 'K' to calculate the Within-Cluster-Sum of Squared Errors (WSS) or inertia. Once the inertia for variable values of 'K' has been generated, the same is then plotted against each cluster to find the point wherein the graph starts flattening. The data science professional can then choose the value of ‘K’ from the identified area.
It allows the data science professional to understand and compare the similarity of a data point with its own cluster to its similarity with other clusters. The values generated are between +1 and -1 with a value closer to +1 being more favorable. A value closer to +1 are indicative of the fact that the data points are within the correct cluster and have a good enough distance from other clusters. -1 indicates that either there are too many clusters or too few clusters.
Repetition of the K-Means Clustering has been known to produce different results, based on the parameters as different initial centroids are assigned in every new algorithm run. The centroids are also not able to move away a great distance from their initial position or move near clusters that are already convergent.
Still, the results can be improved with repeated clustering runs to find the lowest sum of variance within all the clusters. You can also use the following methods:
Advantages:
Disadvantages:
This website uses cookies to enhance website functionalities and improve your online experience. By clicking Accept or continue browsing this website, you agree to our use of cookies as outlined in our privacy policy.