Organizations across industries are investing heavily in predictive analytics, and regression analysis sits at the center of that investment. The global predictive analytics market reached $24.81 billion in 2026 and is projected to grow at a 24.5% CAGR through 2035 (Research Nester). Behind most of that market activity, the forecasting models, risk scoring systems, demand planning tools, and regression are doing the foundational work.
Let us unravel the coe behind regression analysis, the types of regression used by data professionals, its core area of application across industries, and the tools that support it.
What is Regression Analysis?
Regression analysis is a statistical approach used to model how a dependent variable changes in response to an independent variable and to answer the fundamental question: What happens when one variable changes?
A salesman predicting sales from advertising money, a doctor predicting readmission rates for patients based on their treatment, etc., is using regression analysis.
It is essentially a technique to determine the variables that affect a response, measure how much they affect the response, and then create a model that can predict the response from new values of variables.
Types of Regression Analysis
There are different types of regression, depending on the kind of data structure and the type of problem modeled. The main ones listed below are utilized in data science workflows.
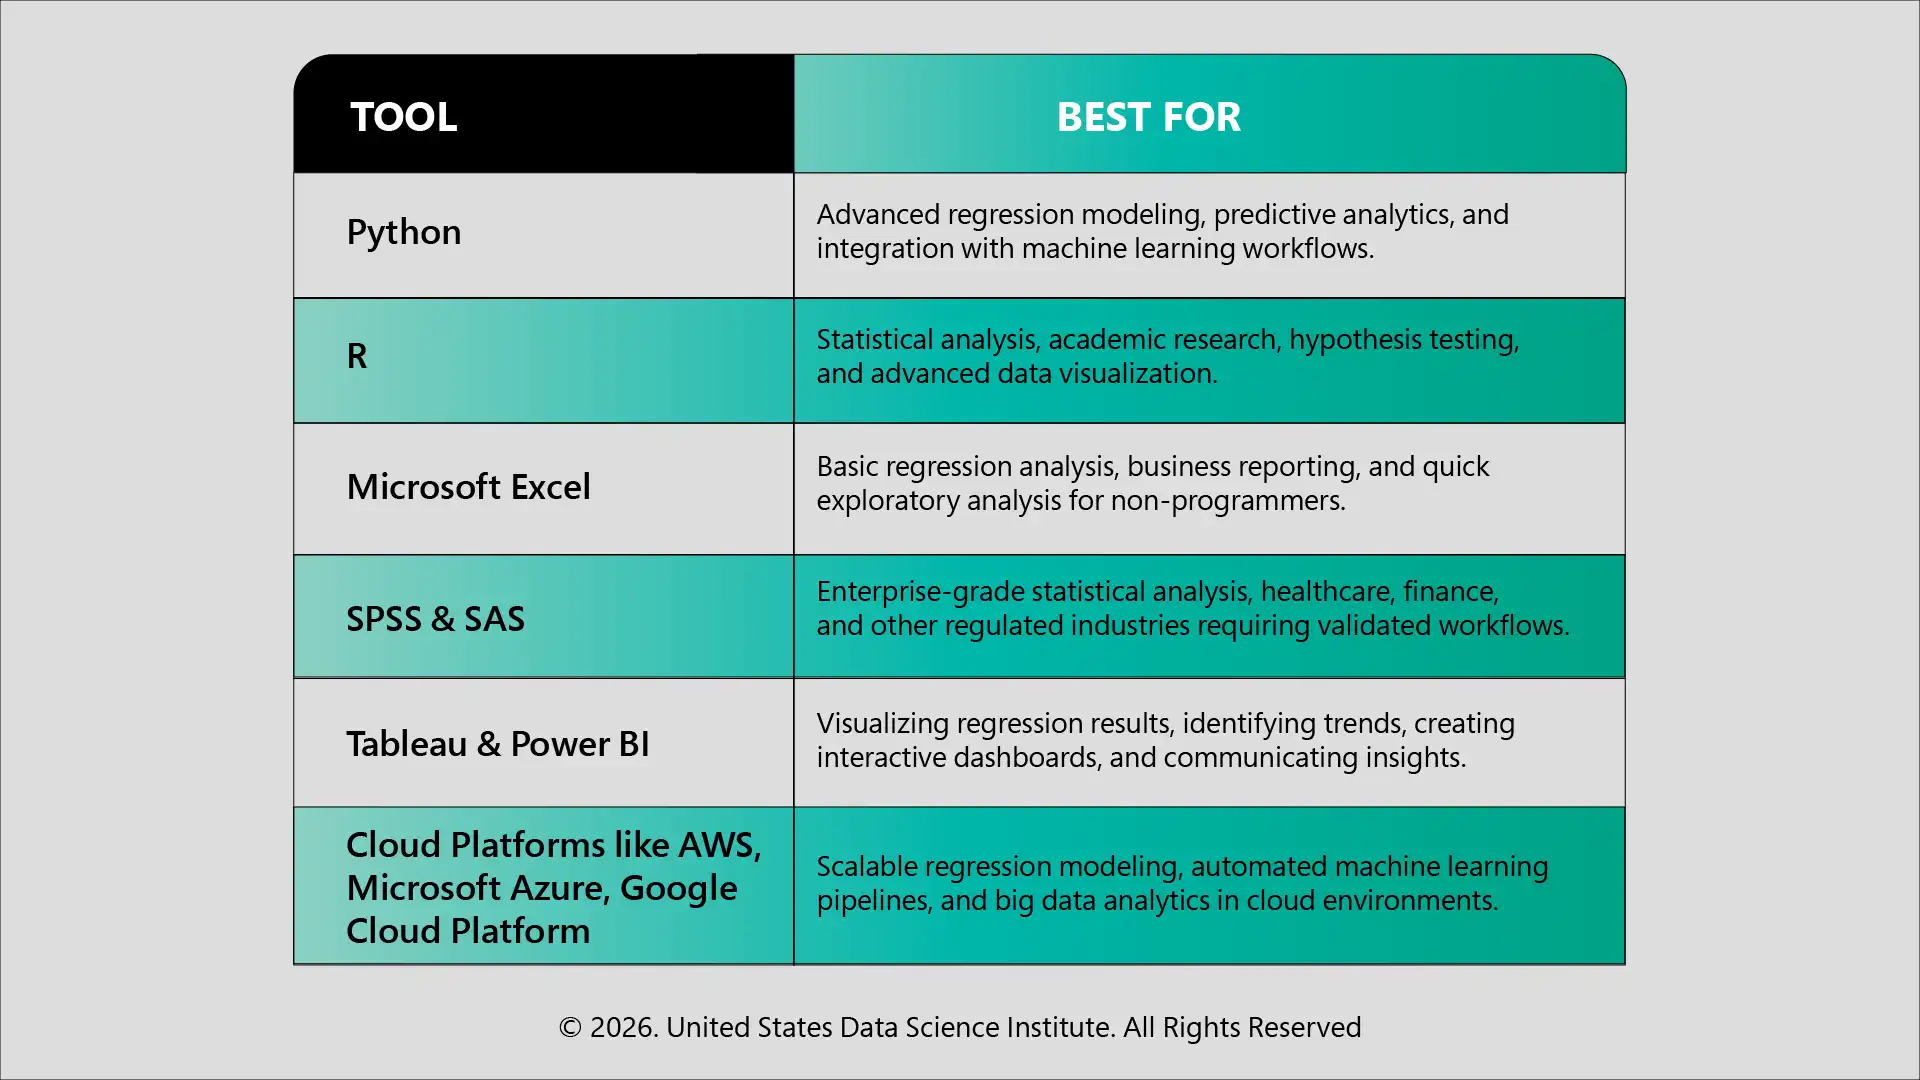
Latest Regression Analysis Tools
Depending on the level of analysis, the technical background of a team, and the deployment of the model, the right tool is required. The following are the most popular regression analysis platforms for 2026.
How Does Regression Analysis Generate Data Insights
Regression analysis converts raw data into quantified, interpretable relationships that organizations can act on with confidence. Here is how the process works.
Step 1: Define the Question
Start with a specific business question. Which factors drive customer churn? What variables predict equipment failure? The dependent variable is the outcome. The independent variables are the factors believed to influence it.
Step 2: Prepare the Data
Clean the dataset, handle missing values, and check that regression assumptions are met before modeling begins.
Step 3: Build the Model
The algorithm is applied to the dataset and learns the relationship between variables by minimizing the error between its predictions and actual observed values.
Step 4: Interpret the Output
Three outputs generate the insight:
Step 5: Apply the Insight
Model output becomes a business decision. A retail company might find that every additional dollar spent on television advertising drives maximum revenue. That single coefficient shapes how the entire marketing budget is allocated for the next quarter.
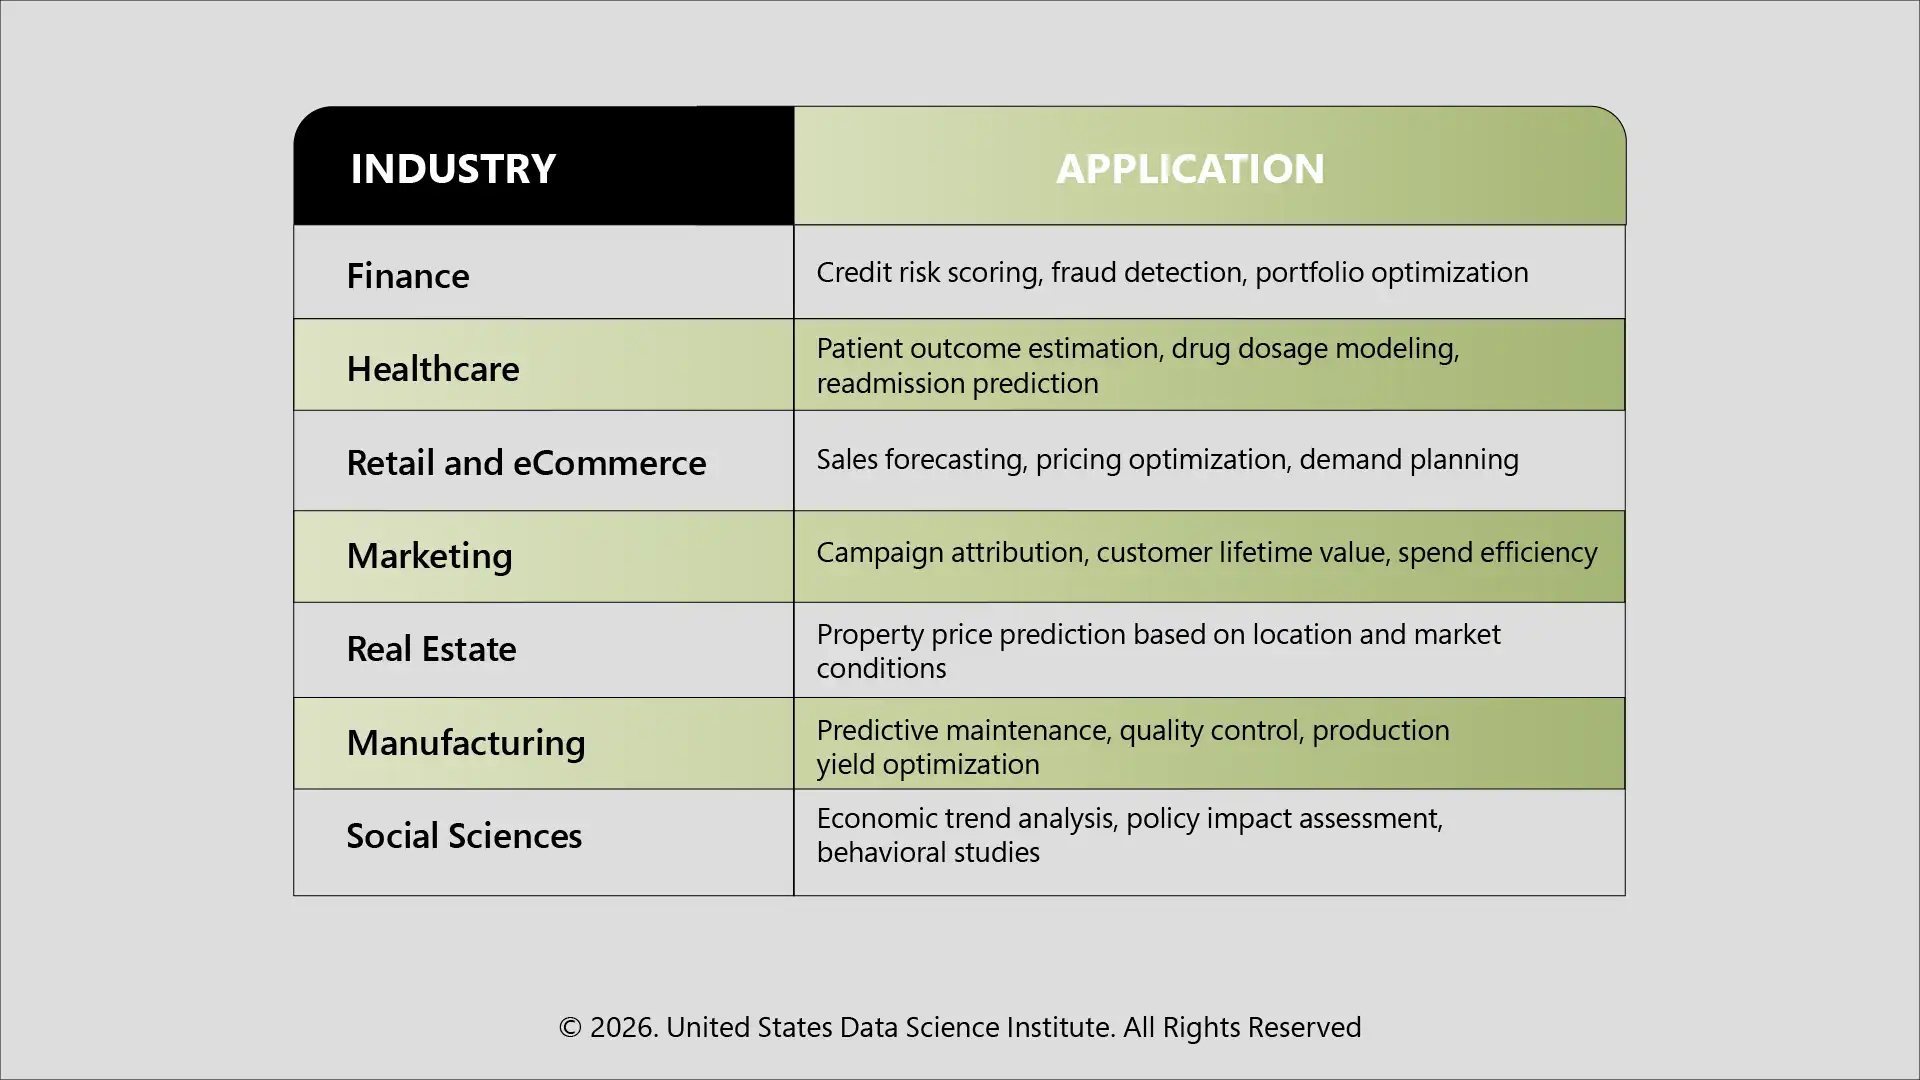
Cross-Industry Applications of Regression Analysis
Regression analysis is applied across virtually every data-intensive industry. Listed below are the domains delivering the most consistent business value from it.
Also read USDSI® insights on 15 Data Science Tools for Beginners and Experts — 2026 Edition. A practical read on the tools data scientists are actually using in 2026, from Python and R to cloud platforms and visualization libraries.
Key Assumptions Every Data Scientist Must Know
The results of regression models are reliable only if some conditions are met. Failure to obey them results in inaccurate results.
If the assumptions are violated, then Ridge regression, Lasso regression, data transformation or non-linear modeling methods are used to rectify it.
The Way Forward
Regression analysis remains one of the most widely applied techniques in data science because it is both interpretable and powerful. It serves as a standalone analytical tool and a foundational layer within larger machine learning pipelines.
The data scientists who apply it correctly, interpret its outputs accurately, and know when to move beyond it are the ones organizations build data teams around. Building that depth requires structured, verified expertise.
USDSI® data science certifications equip professionals with the applied modeling and analytical skills that turn raw data into real business insights in 2026 and beyond. Start building the data science skills today!
This website uses cookies to enhance website functionalities and improve your online experience. By clicking Accept or continue browsing this website, you agree to our use of cookies as outlined in our privacy policy.